
The latest data from Hawaii Information Service for NORTH KONA residential market continues to show a tightening market. Inventory is at the lowest level for this date. Pending sales are strong and probably would be higher if it weren’t for the lack of inventory. This has caused the Pending Ratio to reach a new recovery. It is likely that the record low interest rates plus the relatively virus free environment have contributed to this tight residential market. This is a nation-wide trend with Kona being above average. Median price is up an unsustainable +14%.

The price range data at the top of page 2 shows prices ranges up to $1.5M are in the PEAK demand category. There are only 20 homes now listed below $700,000.


The Hawaii Island Residential Pending Ratio had rebounded sharply since April, but leveled off this past month due to down turnon the East HAWAII. West Hawaii remains in upward trend.

Charts 5 and Chart 6 related to the distressed property shows very low levels of distressed properties on the market. Next update of this chart will be December 31.

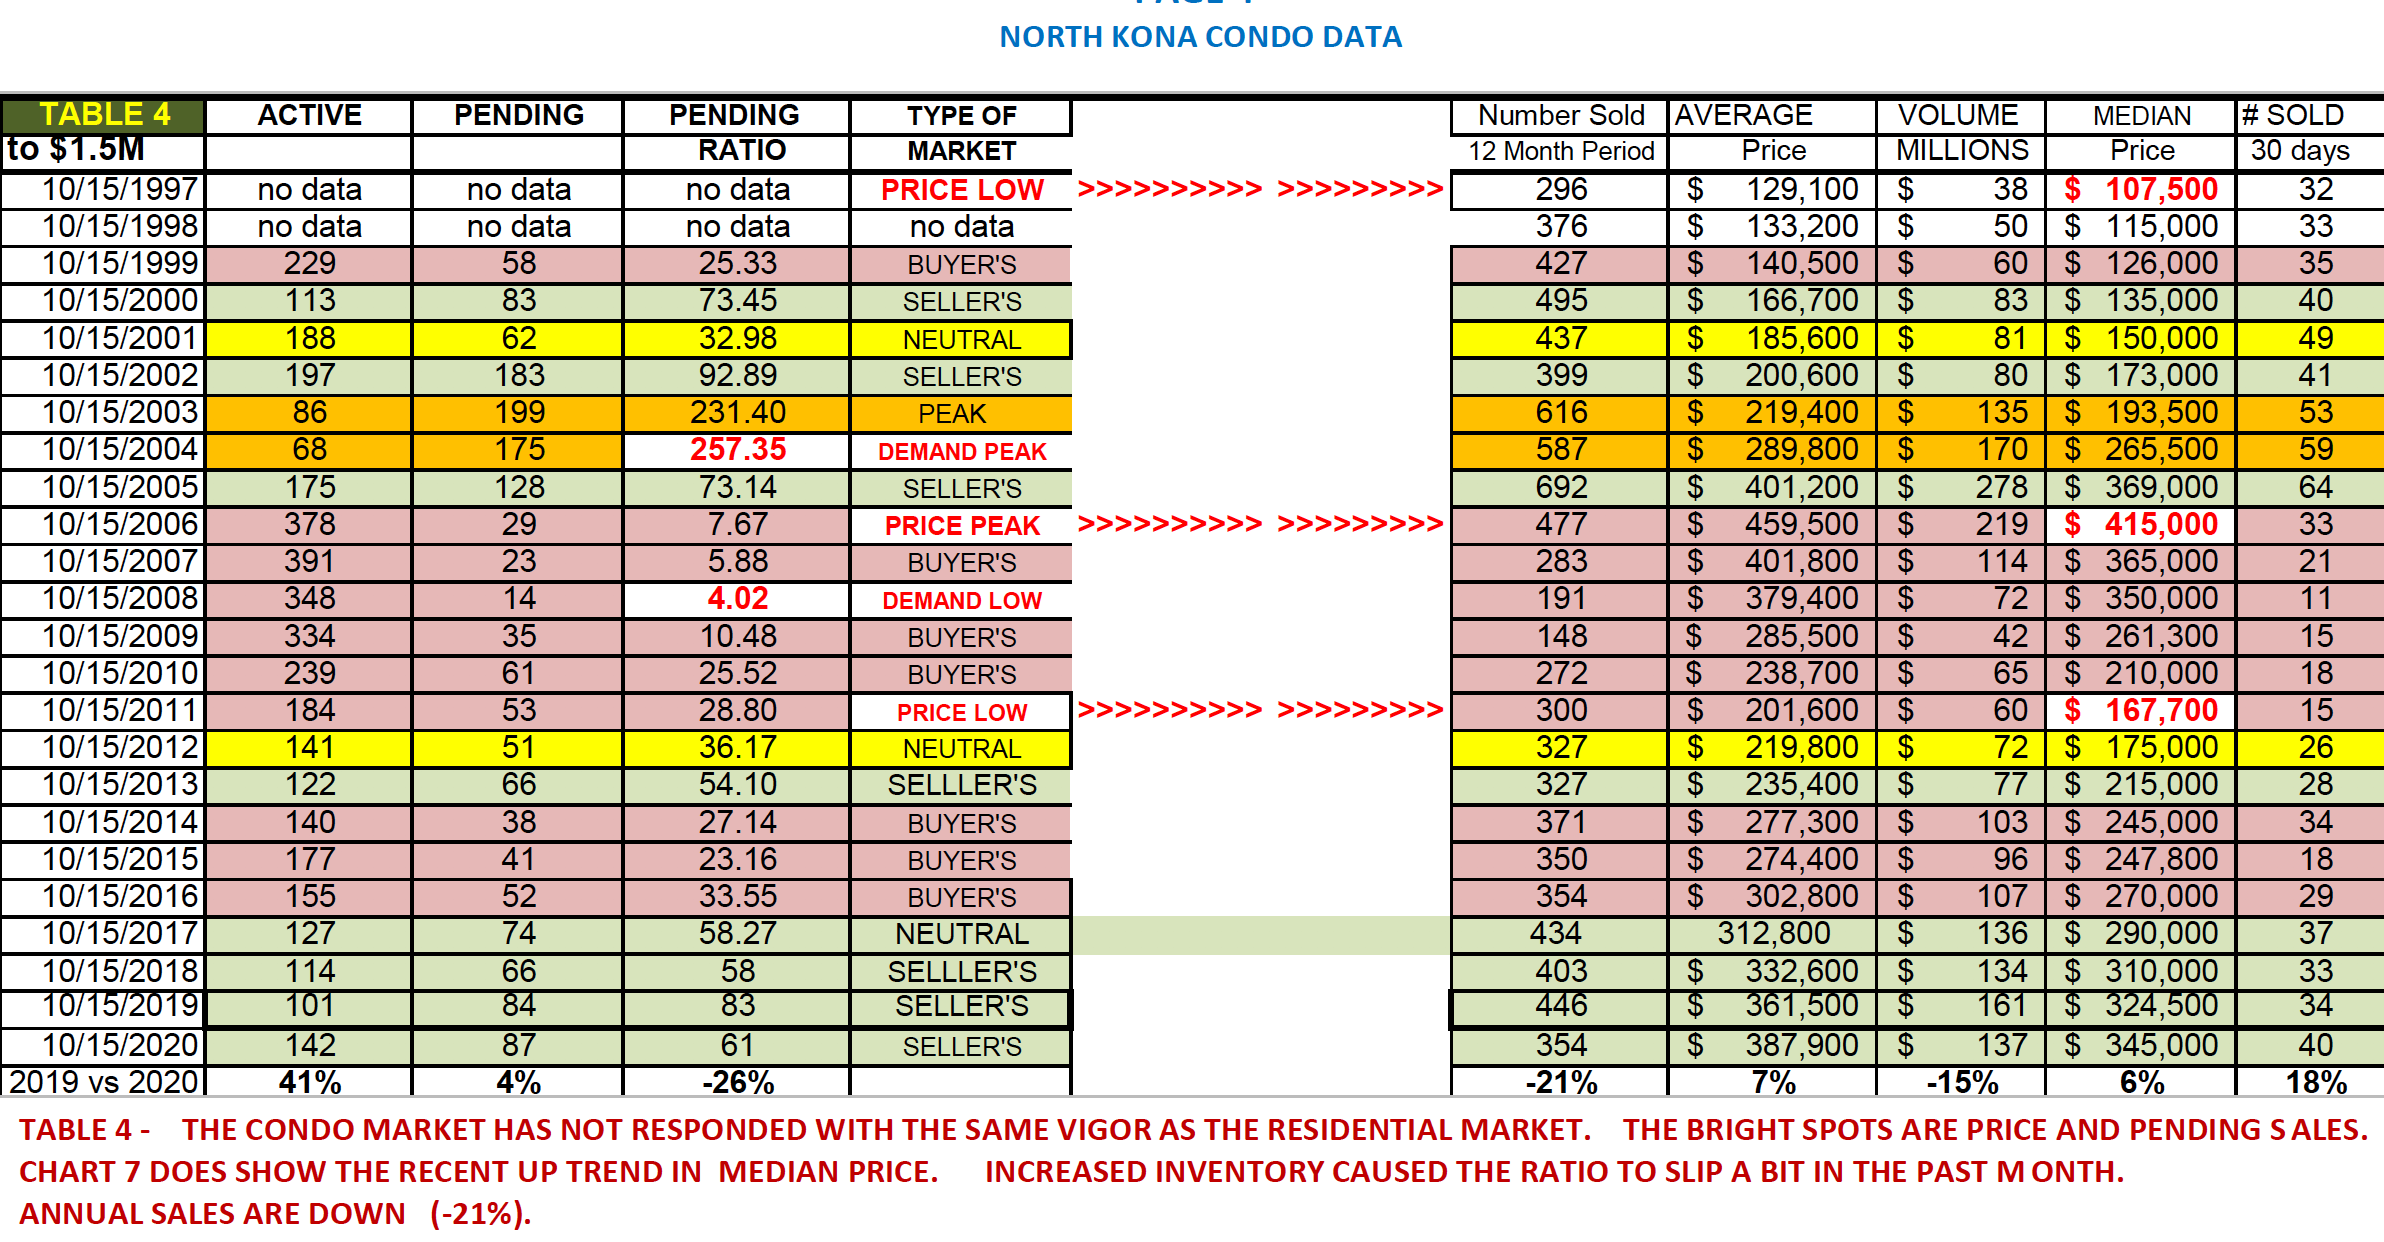
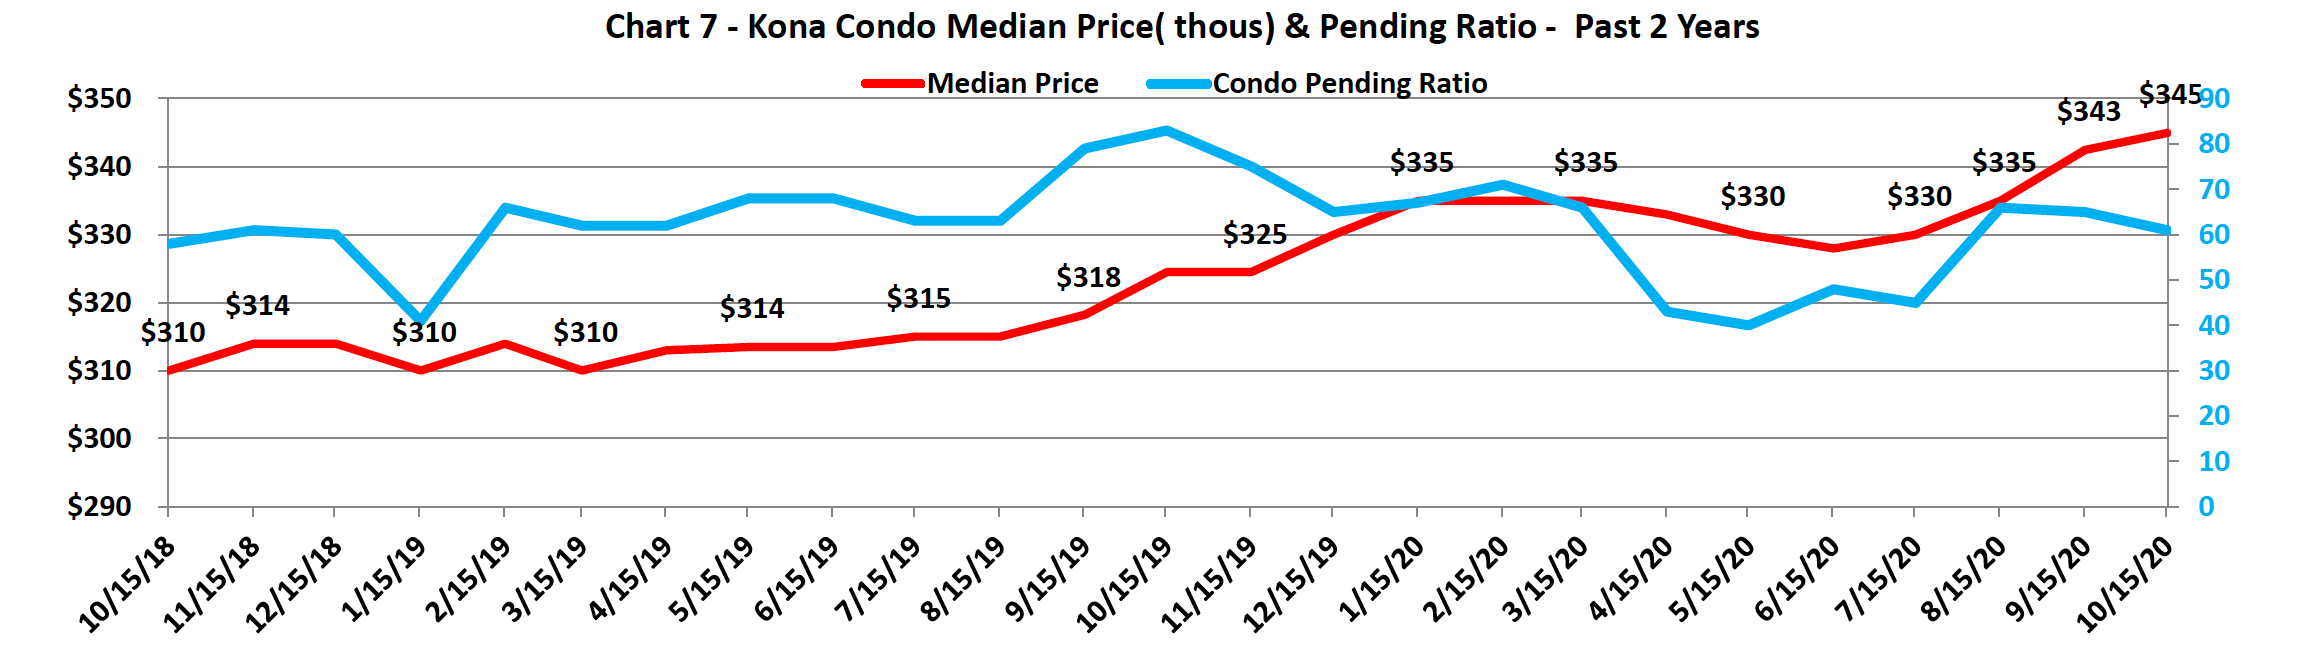
The Condo stats are showing the effects of lack of tourist traffic. Year/Year Sales are off 21%. The good news is the situation is improving. There is an increase in Pending Sales. Prices are increasing.

The Land statistics are following the trend of the improved residential market with sharp decline in inventory and conversely pending sales improved at a greater rate. So far this improved demand does not appear to have affected prices as dramatically yet, with a closer look does show steep price increase in the past month. Its all about demand and its busy!


Pending Ratio Summary page. This page offers a quick glance of the Pending Ratio trend for North Kona Residential, Condo, Land and Hawaii Island. This table shows improvement from last year and also since last month. The higher price ranges of the Residential market appear to be the most improved.

To wrap up check out the Kona Residential Price chart comparison since 1972 is updated with the new 2019 data. This is based on a data pool of similar homes many of which are either new sales or resales over the years. The total number of sales that make up the data pool is over 7,644 units in the 23 subdivisions in the study. The result shows the 2019 average price was (plus six percent +6%) or $650,900.


Demand on the Island of Hawaii has risen dramatically in lieu of the world facing a pandemic. I’ve been fortunate and successful in this business long enough to know that Hawaii my life long home is a niche that the world absolutely loves. There truly is no place quite like Hawaii so if now is the time and you’ve been dreaming of a piece of paradise contact me today!
As always mahalo nui to Michael Griggs Realtor Broker here on the Big Island who shares his data insights and statistics with fellow colleagues and allows me to provide it to the general public as well. Mahalo Michael as always I couldn’t be more grateful.
Until Next time…A Hui Hou!
